If you’ve ever wondered what crest factor, PSR and PLR mean and what they’re used for, this article is for you. We’ll see how crest factor and PSR are related, how they can be used to measure dynamics and what levels to shoot for.
What is Crest Factor?
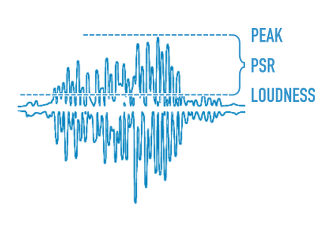
Crest factor is a measure of dynamics. It is the difference between your peak and average levels:
Your “average” levels could be measured in several ways: with a VU meter, an RMS meter or a loudness meter, for example. For that reason, crest factor is more of an abstract concept than a defined standard.
Crest factors are measured in decibels. For example, if your peak level is -1 dBFS and your average level is -14 dBFS RMS, the crest factor would be:
Higher crest factors indicate the presence of more dynamics than lower crest factors.
Peak to Short-Term Loudness Ratio
Peak to Short-Term Loudness Ratio (PSR)
In developing Ian Shepherd’s Dynameter, we wanted a crest factor-like measurement that was based on the international loudness standard, ITU BS.1770, so we coined the term Peak to Short-Term Loudness Ratio (PSR). PSR is defined as the difference between the true-peak level and the short-term loudness ():
It is similar to the idea of a crest factor but is more precisely defined.
You may have heard of another, similar measurement called Peak to Loudness Ratio (PLR). The difference between the two is that PLR is a long-term measurement that can be applied to an entire song, album or TV programme whereas PSR is a real-time measurement that has a three second “window.”
Loudness Management and Online Streaming
Online streaming services like iTunes, Spotify, Tidal and YouTube use loudness management to level the playback volume of songs, ensuring a consistent listening experience. They do this by turning loud songs down.
The great thing about PSR, PLR and crest factor is that they are invariant with respect to the playback level. In other words, they do not change when the playback level changes. In contrast, the average and peak levels of a song do change when the playback level changes.
For example, imagine that your song has a PSR of 10 at some point in time. Now, imagine that a gain of 3 dB is applied. What will the new PSR be? A constant gain offset of 3 dB will increase both the short-term loudness and the peak levels by the same amount, so we get:
Notice that the gain cancels out and we are left with the original PSR of 10! So, while you may not be able to predict the final average or peak levels of your song, you can predict the final PSR, which measures dynamics. There is one caveat however: in some cases Spotify will apply limiting which does affect PSR. This tends to happen when Spotify boosts the volume of a dynamic song. Rather than clipping the signal, Spotify will apply limiting in an attempt to bring the peak levels below 0 dBFS.
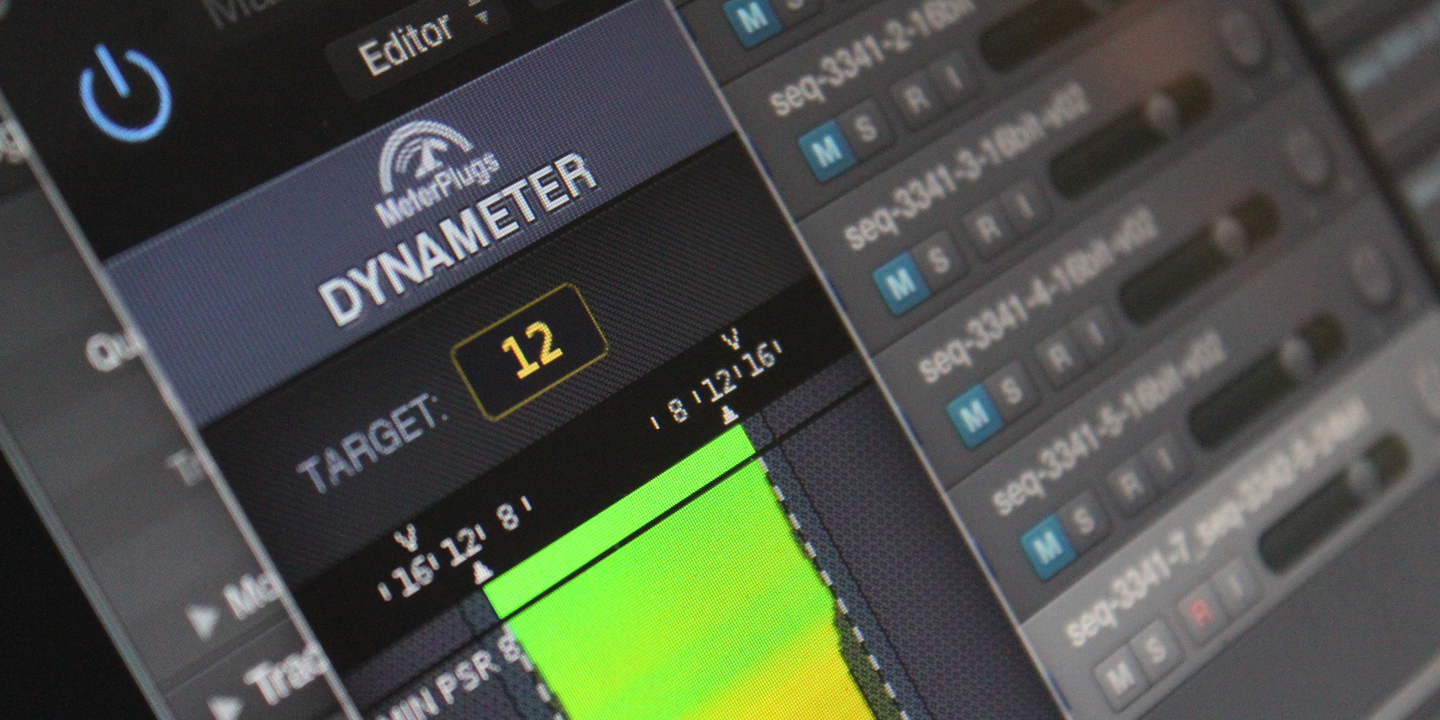
The Magic of PSR 8
If you start measuring PSR, what levels should you shoot for?
Mastering engineer Ian Shepherd (co-creator of our Dynameter plugin) recommends going no lower than PSR 8 during the loudest parts of a song. This goes for music in any genre. Anything less than this will often sound crushed.
PSR becomes even more useful when used in conjunction with PLR, which you can read more about in Why Loudness Doesn’t Matter.